Community Data
High Blood Pressure Prevalence
Quick Facts:
- About 47% of Americans have been diagnosed with high blood pressure (hypertension). Out of those diagnosed, only about 1 in 4 Americans follow recommended treatment plans.
- Men have a higher rate of high blood pressure than women.
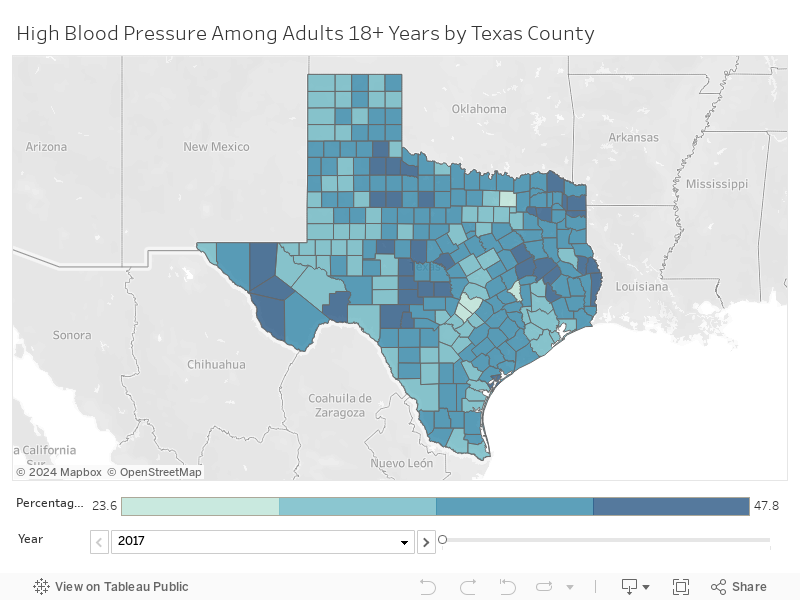
- Taylor County is located in Public Health Region (PHR) 2 in Texas. As of 2016, Region 2 had the second highest prevalence of high blood pressure in Texas.

What is High Blood Pressure?
High blood pressure, referred to as hypertension. Blood pressure is determined by how much blood your heart pumps, and your blood vessels. If your arteries are more narrow, and your heart is pumping more blood this can lead to high blood pressure. Blood pressure reading gives two numbers: the top number (systolic) and the bottom number (diastolic). The systolic number measures the pressure in your arteries when your heart beats. The diastolic number measures the pressure in your arteries between beats or your heart.
Risk factors for high blood pressure include: poor diet, not exercising, smoking, family history, age, race/ethnicity, and having additional chronic medical conditions.


High Blood Pressure in Our Community
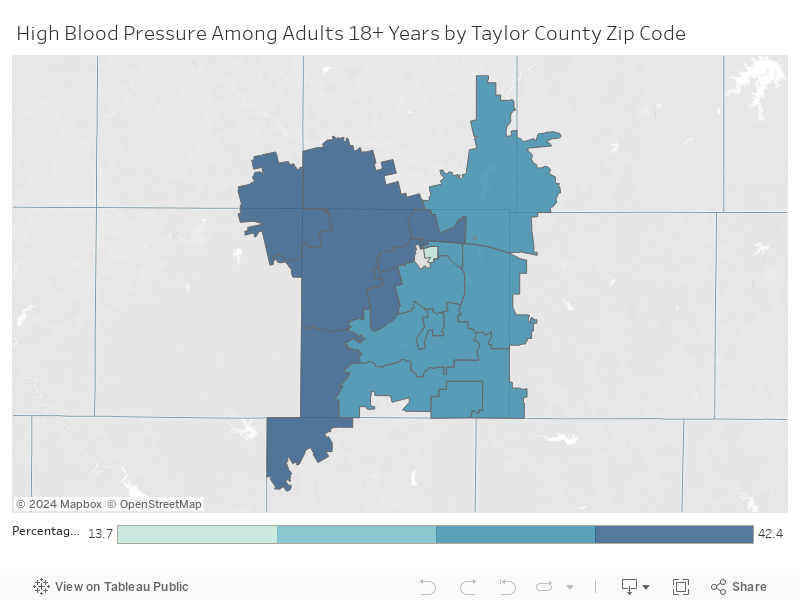
Darker colors on the interactive maps indicate worse outcomes.
In 2017, about 1 in 3 Taylor County adults reported being diagnosed with high blood pressure. In 2019, this statistic remained about the same, with 31.3% of adults in Taylor County reporting having hypertension. The Taylor County zip codes that had the highest high blood pressure rates in 2019 were 79566 (42.4%), 79561 (38.6%), and 79603 (36.6%). The zip code in Taylor County that had the lowest rate of high blood pressure was 79607 (13.7%). The remaining zip codes in Taylor County had high blood pressure rates ranging between 30.3% and 35.7%.
Community Data
Use of Blood Pressure Medication
Quick Facts:
- About 30% of U.S. adults don’t know that they have high blood pressure and aren’t being treated for it.
- In 2017, about 116 million Americans reported having high blood pressure. Of those, about 79%, or 92 million Americans were recommended to take high blood pressure medication by their physician.
- In the US, age-standardized use of high blood pressure medication was 59.6%. The usage of high blood pressure medication in Texas was slightly lower in 2017 at 57.5%.
- Age-standardized high blood pressure medication usage was highest among blacks (68.1%) and women (64.0%).
Why is Blood Pressure Medication Use Important?
High blood pressure, or hypertension, can increase your risk of heart disease or having a stroke. You can learn more about high blood pressure here. Of the 116 million U.S. adults with high blood pressure, about 92 million were told to take medication and make a lifestyle change. Despite recommendations from their doctors, more than 34 million U.S. adults do not take their high blood pressure medication as prescribed.
Blood Pressure Medication Usage in Our Community
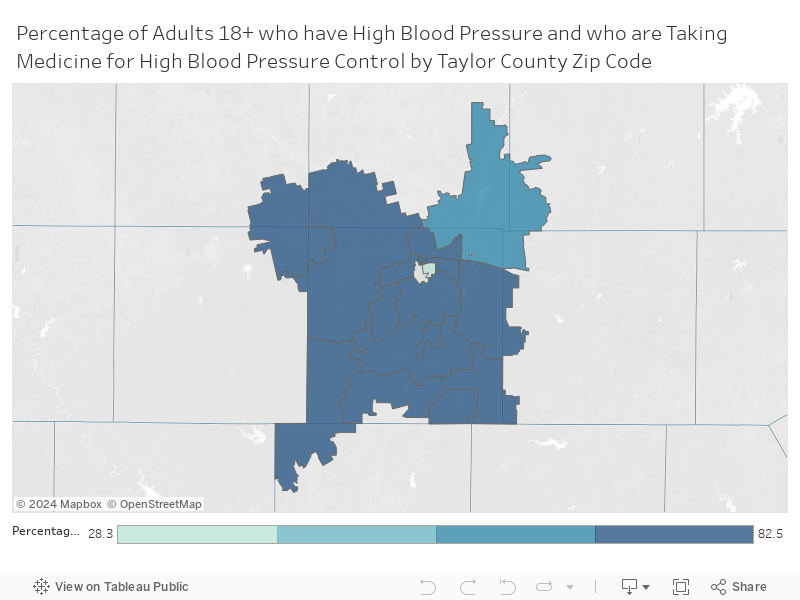
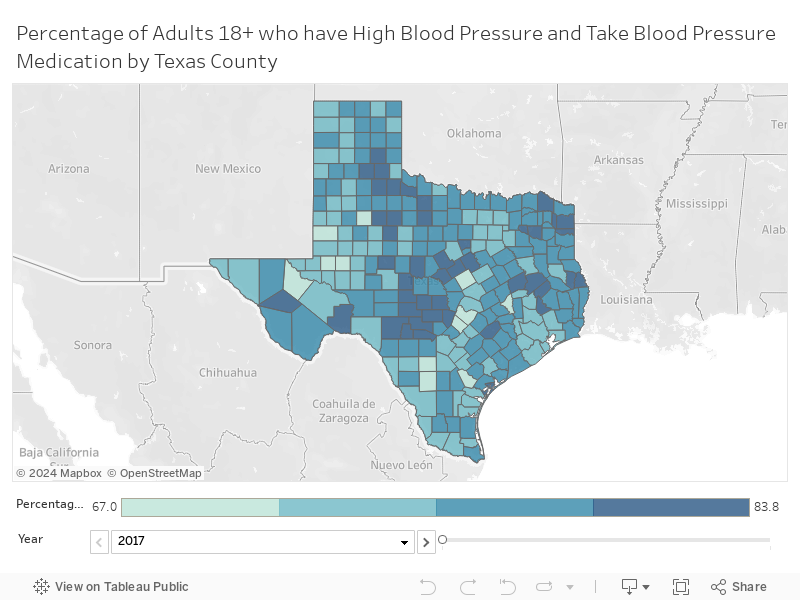
Darker colors indicate more individuals controlling high blood pressure with medication.
In 2017, 74.2% of adults who were diagnosed with high blood pressure were taking medication to control it. This number decreased by 2019 to 73.0% of adults who were diagnosed with high blood pressure in Taylor County. The zip code with the highest percent of adults controlling high blood pressure with medication usage was 79566. In this zip code, approximately 82.5% of residents who were diagnosed with high blood pressure were taking medication.
Click for Data Sources
References:
Centers for Disease Control and Prevention. (2021, September 27). Facts About Hypertension. Centers for Disease Control and Prevention. Accessed June 23, 2022 from https://www.cdc.gov/bloodpressure/facts.htm
Texas Department of State Health Services. (2017, October 20). High Blood Pressure Prevalence Among Adults By Public Health Region (PHR), Texas, 2016. Texas Health and Human Services. Accessed June 23, 2022 from https://www.dshs.state.tx.us/heart/pdf/Blood-Pressure-Monitoring/2016-HBPP-by-PHR.pdf
Centers for Disease Control and Prevention. (2021, September 27). Know Your Risk for High Blood Pressure. Centers for Disease Control and Prevention. Accessed June 23, 2022 from https://www.cdc.gov/bloodpressure/risk_factors.htm
State of Childhood Obesity. (2021, September). Hypertension in the United States. Robert Wood Johnson Foundation. Accessed June 23, 2022 from https://stateofchildhoodobesity.org/hypertension/
CDC, National Center for Chronic Disease Prevention and Health Promotion, Division of Population Health. PLACES: County Data (GIS Friendly), 2021 release. https://chronicdata.cdc.gov/500-Cities-Places/PLACES-County-Data-GIS-Friendly-Format-2021-releas/i46a-9kgh
CDC, National Center for Chronic Disease Prevention and Health Promotion, Division of Population Health. PLACES: County Data (GIS Friendly), 2020 release. https://chronicdata.cdc.gov/500-Cities-Places/PLACES-County-Data-GIS-Friendly-Format-2020-releas/mssc-ksj7
CDC, National Center for Chronic Disease Prevention and Health Promotion, Division of Population Health. PLACES: ZCTA Data (GIS Friendly), 2021 release. https://chronicdata.cdc.gov/500-Cities-Places/PLACES-ZCTA-Data-GIS-Friendly-Format-2021-release/kee5-23sr
Centers for Disease Control and Prevention (CDC). Hypertension Cascade: Hypertension Prevalence, Treatment and Control Estimates Among US Adults Aged 18 Years and Older Applying the Criteria From the American College of Cardiology and American Heart Association’s 2017 Hypertension Guideline—NHANES 2015–2018. Atlanta, GA: US Department of Health and Human Services; 2021.
Centers for Disease Control and Prevention. (2021, September 27). Facts About Hypertension. Centers for Disease Control and Prevention. Accessed June 3, 2022 from https://www.cdc.gov/bloodpressure/facts.htm
Centers for Disease Control and Prevention. (2021, September 27). 5 Surprising Facts About High Blood Pressure. Centers for Disease Control and Prevention. Accessed June 3, 2022 from https://www.cdc.gov/bloodpressure/5_surprising_facts.htm
CDC, National Center for Chronic Disease Prevention and Health Promotion, Division of Population Health. PLACES: County Data (GIS Friendly), 2021 release. https://chronicdata.cdc.gov/500-Cities-Places/PLACES-County-Data-GIS-Friendly-Format-2021-releas/i46a-9kgh
CDC, National Center for Chronic Disease Prevention and Health Promotion, Division of Population Health. PLACES: County Data (GIS Friendly), 2020 release. https://chronicdata.cdc.gov/500-Cities-Places/PLACES-County-Data-GIS-Friendly-Format-2020-releas/mssc-ksj7
CDC, National Center for Chronic Disease Prevention and Health Promotion, Division of Population Health. PLACES: ZCTA Data (GIS Friendly), 2021 release. https://chronicdata.cdc.gov/500-Cities-Places/PLACES-ZCTA-Data-GIS-Friendly-Format-2021-release/kee5-23sr