Community Data
Stroke
Quick Facts:
- Someone in the US has a stroke every 40 seconds.
- Stroke is a leading cause of serious long-term disability.
- Someone in the US dies of a stroke about every 4 minutes.
- Stroke was the 5th overall leading cause of death in 2020.
- Stroke-related costs in the US in 2014-2015 were nearly $46 billion. This figure includes health care services, medications, and missed days of work.
- The risk of having a first stroke is almost 2 times higher for blacks as for whites.
- About 4 in 5 strokes are preventable.

What is a stroke?
A stroke, or brain attack, happens when blood flow is blocked to the brain which causes brain tissue to become damaged or die. There are 3 main types of stroke:
- Ischemic strokes happen when blood clots block blood vessels to the brain. Nearly 90% of strokes are ischemic strokes.
- Hemorrhagic strokes happen when a blood vessel in the brain bursts which causes blood to build up and damage nearby brain tissue. High blood pressure is an example of a condition that can cause a hemorrhagic stroke.
- Transient ischemic attacks (TIA), sometimes called “mini strokes”, are not a major type of stroke since blood flow to the brain is blocked for a short amount of time, usually less than 5 minutes. This type of stroke is a warning sign of a future stroke and is a medical emergency that requires emergency care.
- More than ⅓ of people who have a TIA and don’t get treatment have a major stroke within 1 year.
- As many as 10-15% of people will have a major stroke within 3 months of a TIA.
Even though the brain only makes up a small percent of your body weight, it uses 20% of the oxygen you breathe. Brain cells start to die within minutes if they can’t get enough oxygen. This is why it is important to know the signs and symptoms of a stroke. Every minute counts.

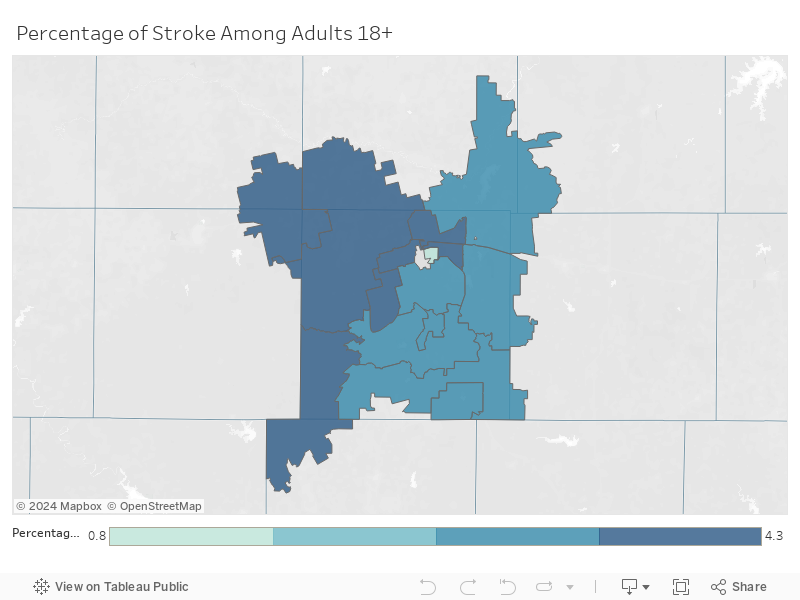
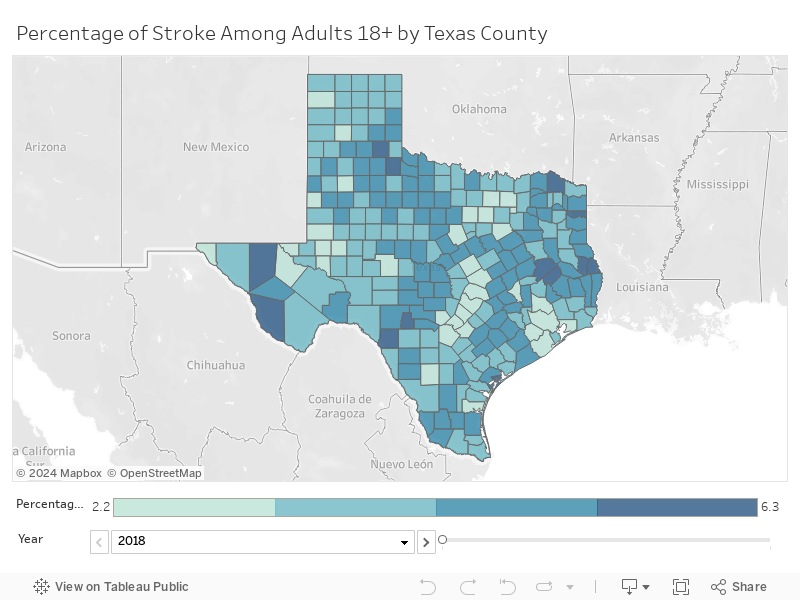
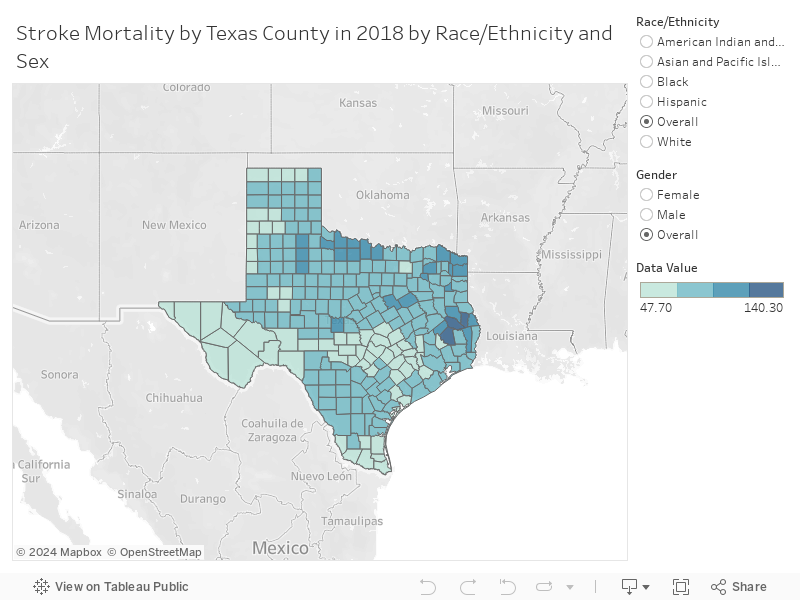
Stroke in Our Community
Darker colors on the interactive maps indicate worse outcomes.
In 2018, about 3.3% of adults in Taylor county had experienced a stroke, which is roughly 3,400 individuals. This percentage slightly decreased in 2019 to 3.1% or 3,200 adults in Taylor county who experienced a stroke.
The two Taylor County zip codes with the highest percentage of adults who experienced a stroke were 79566 and 79561. The zip codes with the lowest percentage of adults who experienced a stroke were 79607 and 79699.
Click for Data Sources
- Centers for Disease Control and Prevention. (2021, August 27). About adult BMI. Centers for Disease Control and Prevention. Retrieved February 28, 2022, from https://www.cdc.gov/healthyweight/assessing/bmi/adult_bmi/index.html
- Centers for Disease Control and Prevention. (2021, March 17). About child & teen BMI. Centers for Disease Control and Prevention. Retrieved February 28, 2022, from https://www.cdc.gov/healthyweight/assessing/bmi/childrens_bmi/about_childrens_bmi.html
- Centers for Disease Control and Prevention. (2021, March 19). Childhood obesity causes & consequences. Centers for Disease Control and Prevention. Retrieved February 28, 2022, from https://www.cdc.gov/obesity/childhood/causes.html#Consequences
- DSHS Health Data. 2011-2020 Data Tables. Accessed Feb 14, 2022. https://healthdata.dshs.texas.gov/dashboard/surveys-and-profiles/brfss
- Hales CM, Carrol MD, Fryar CD, Ogden CL. Prevalence of obesity and severe obesity among adults: United States, 2017-2018. NCHS Data Brief, no 360. Hyattsville, MD: National Center for Health Statistics. 2020. Accessed February 14, 2022 from https://www.cdc.gov/nchs/products/databriefs/db360.htm
- County Health Rankings & Roadmaps. Taylor County, TX 2021 Rankings. https://www.countyhealthrankings.org/app/texas/2021/overview
- The Michael & Susan Dell Center for Health Living. “Texas Child Health Status Report: Child Obesity Crisis in Texas”. Updated October 19, 2021. https://sph.uth.edu/research/centers/dell/texas-child-health-status-report/
- Data source: CDC, National Center for Chronic Disease Prevention and Health Promotion, Division of Population Health. PLACES: County Data (GIS Friendly), 2021 release. https://chronicdata.cdc.gov/500-Cities-Places/PLACES-County-Data-GIS-Friendly-Format-2021-releas/i46a-9kgh
- Data source: CDC, National Center for Chronic Disease Prevention and Health Promotion, Division of Population Health. PLACES: County Data (GIS Friendly), 2020 release. https://chronicdata.cdc.gov/500-Cities-Places/PLACES-County-Data-GIS-Friendly-Format-2020-releas/mssc-ksj7
- Data source: CDC, National Center for Chronic Disease Prevention and Health Promotion, Division of Population Health. PLACES: ZCTA Data (GIS Friendly), 2021 release. https://chronicdata.cdc.gov/500-Cities-Places/PLACES-ZCTA-Data-GIS-Friendly-Format-2021-release/kee5-23sr
- County Health Rankings & Roadmaps. Taylor County, TX 2010-2021 Rankings. https://www.countyhealthrankings.org/explore-health-rankings/rankings-data-documentation